A full chart, ready to use
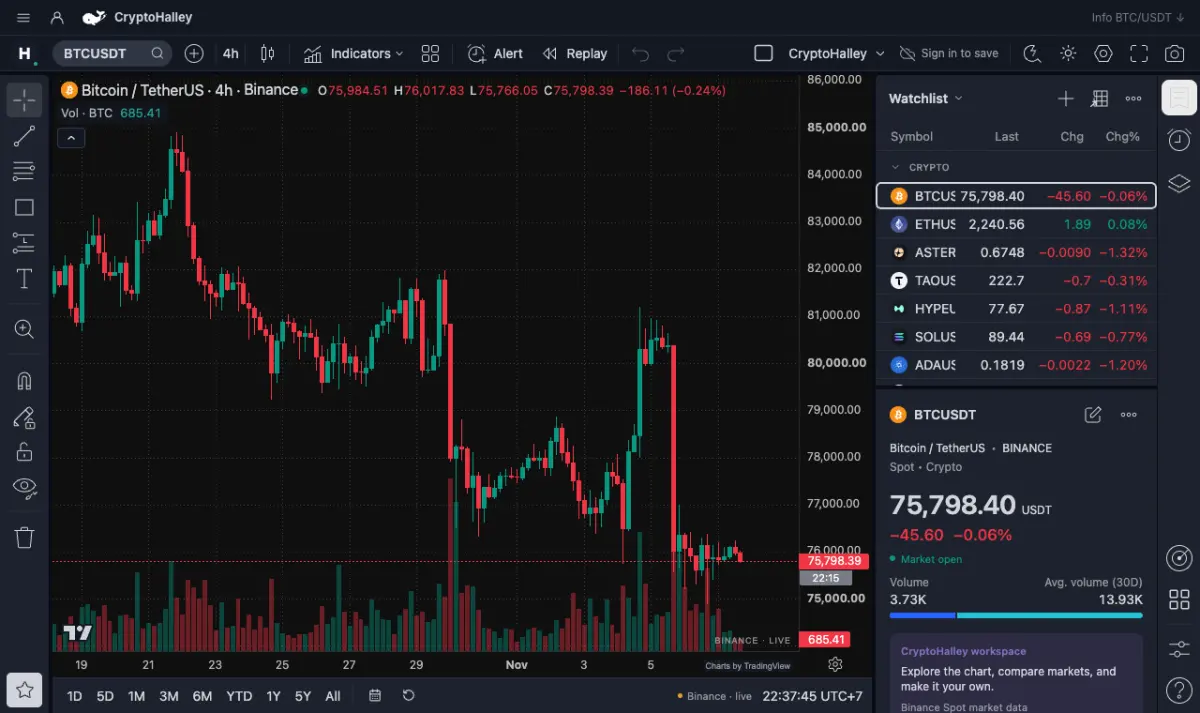
Realtime candles from Binance, indicators, drawing tools and a watchlist. Opens in your browser, no sign-up.
Open chart →Data · Analysis · Whale moves
Price, open interest, liquidations and whale positions on one screen.
 BTC
 ETH
 SOL
 BNB
 XRP
Overall crypto market conditions, last 24 hours.
Realtime candles from Binance, indicators, drawing tools and a watchlist. Opens in your browser, no sign-up.
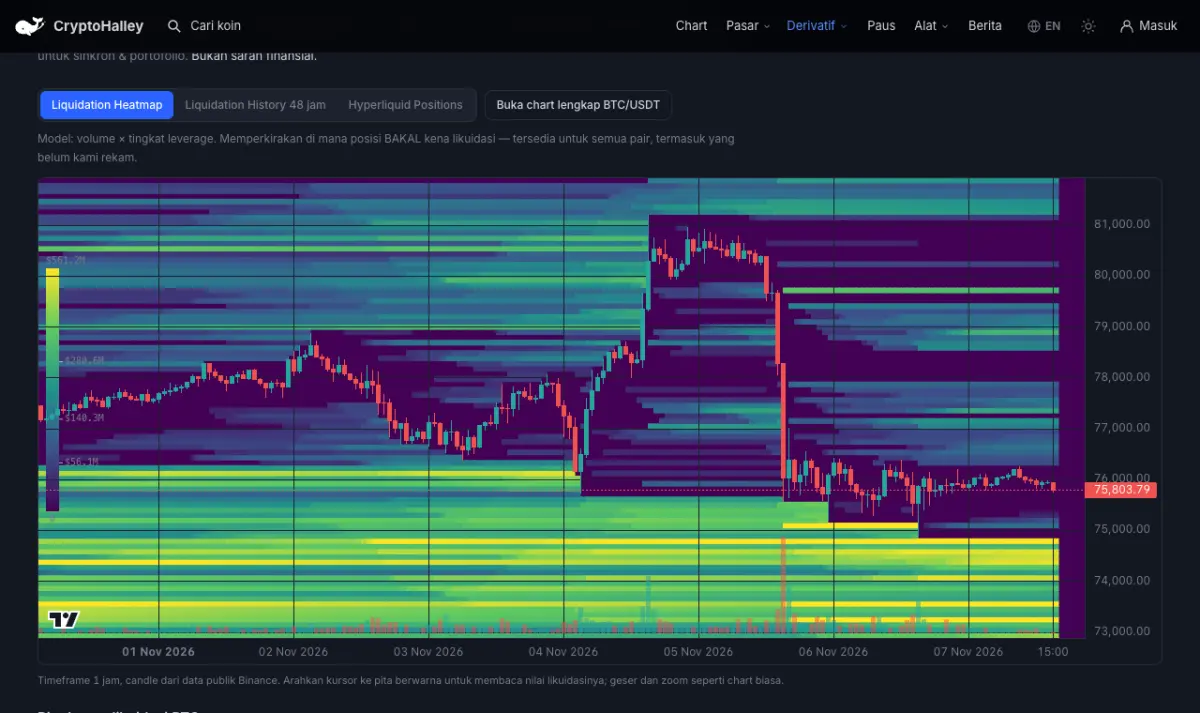
Open chart →A 48-hour BTC liquidation map: the price levels where the most leveraged positions are at risk.
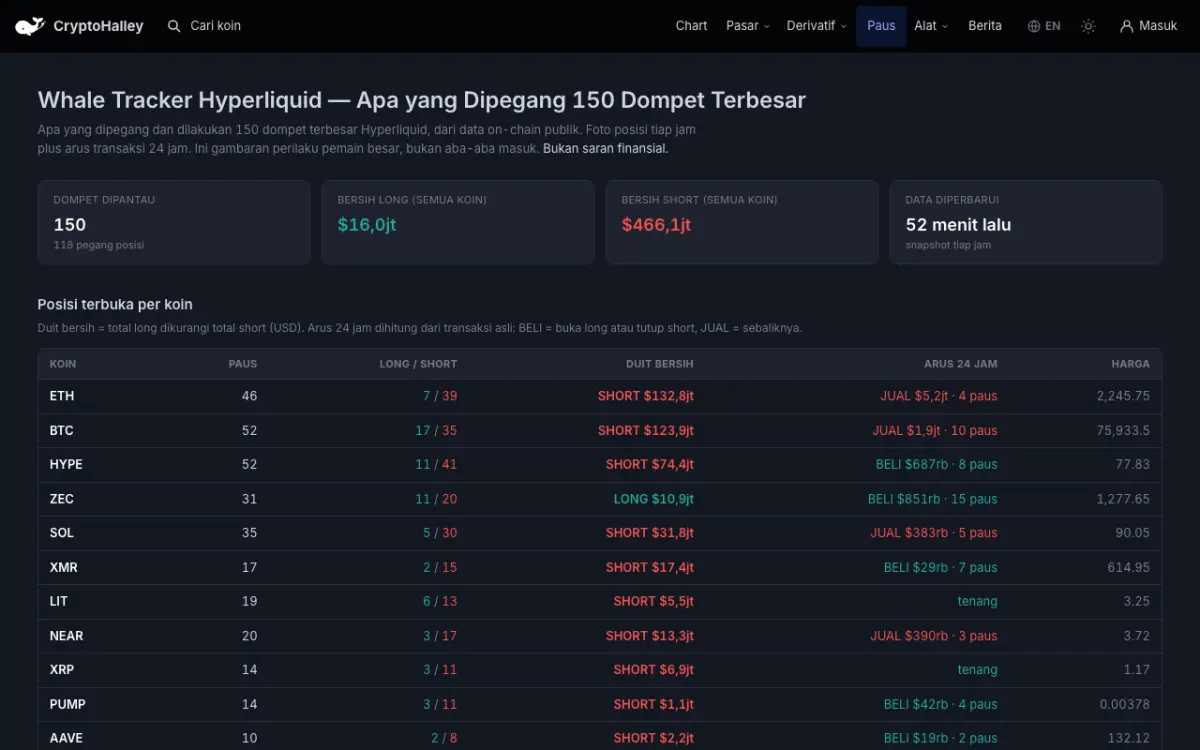
Open liquidation map →The 150 largest Hyperliquid wallets: who is long, who is short, and what they added today.
Track whales →Move the price and watch the stacks of leveraged positions fall one by one.
Morning market weather and whale moves, sent every day.
Yes. The chart, liquidation map, open interest data and whale tracker are free without an account. Log in only to save your chart layout and watchlist.
Prices and candles come straight from the exchanges (Binance, Bybit, OKX, KuCoin, MEXC). Whale positions come from public Hyperliquid on-chain data.
BTC price, open interest, 24h liquidations, Fear & Greed and your watchlist are on the Market overview page.